
How Do I Find Podcasts to Guest Appear On?
Growth and Trends
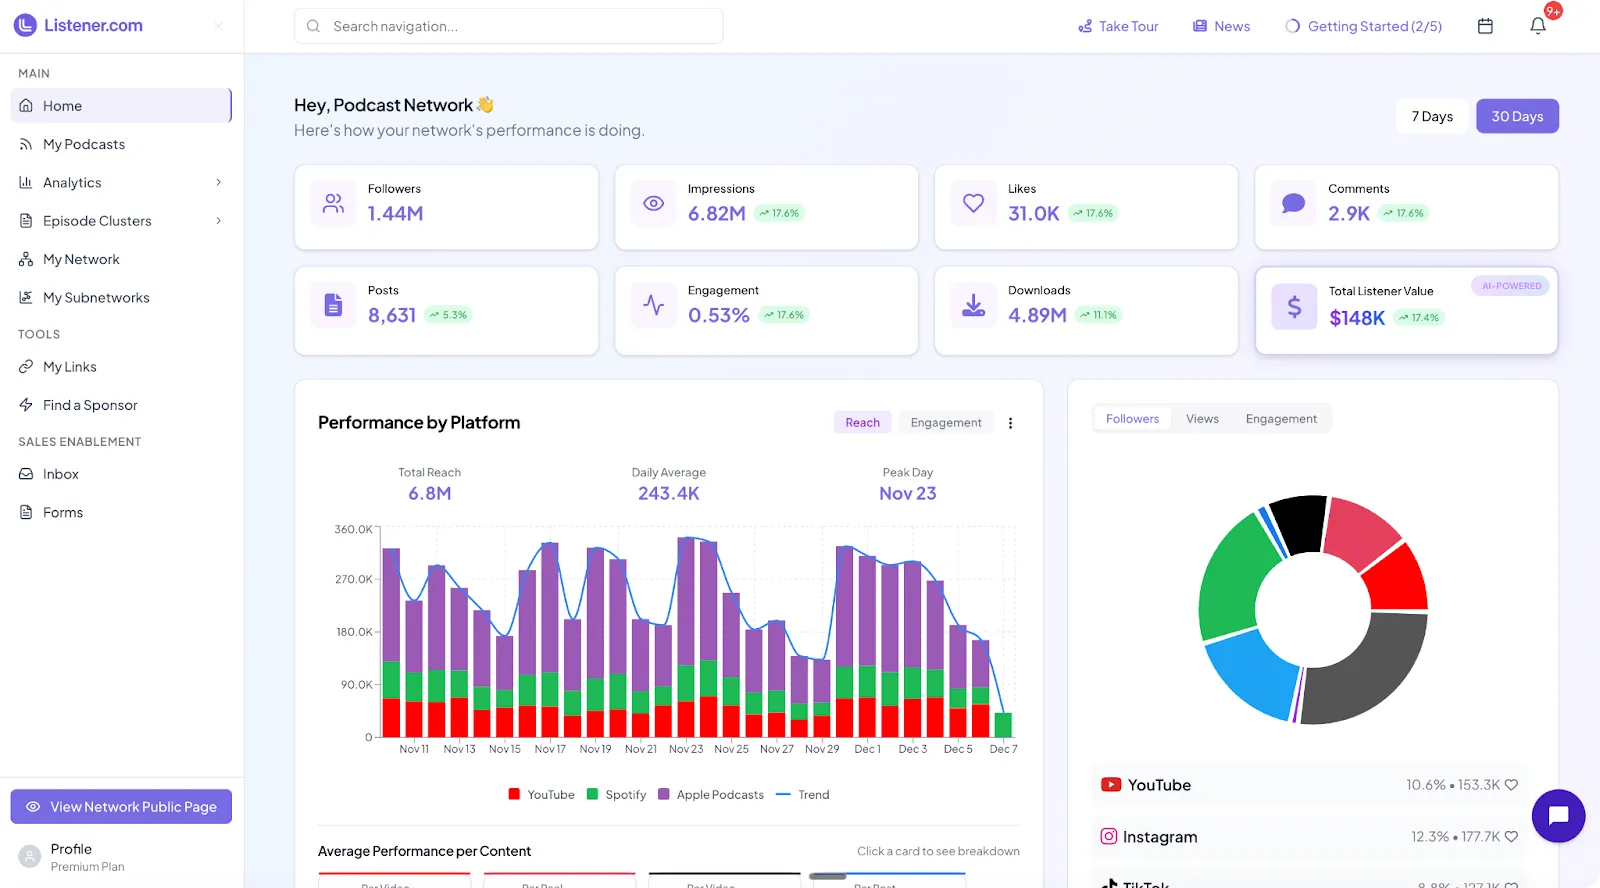
Track performance across every show, channel, and platform — all in one place. Centralize audio, video, short-form, and social analytics into a single intelligent dashboard.


See the measurable difference when your team operates from one intelligent dashboard. Listener turns fragmented metrics into clear, actionable insights that power faster decisions, sharper storytelling, and stronger sales outcomes.
Reduction In Manual Reporting Time.
Faster Sponsor Deck Creation.
Platform-Wide Data Accuracy.
Average Time To Generate Network-Level Reports.

See total reach, listener demographics, engagement, and episode breakdowns across your network. Identify your top-performing content and talent in real time without switching tabs or exporting spreadsheets.
Track audience growth across audio, video, and social.
Search, segment, isolate — insights on demand.
Your dashboard refreshes automatically — never manually report again.
.webp)
.webp)
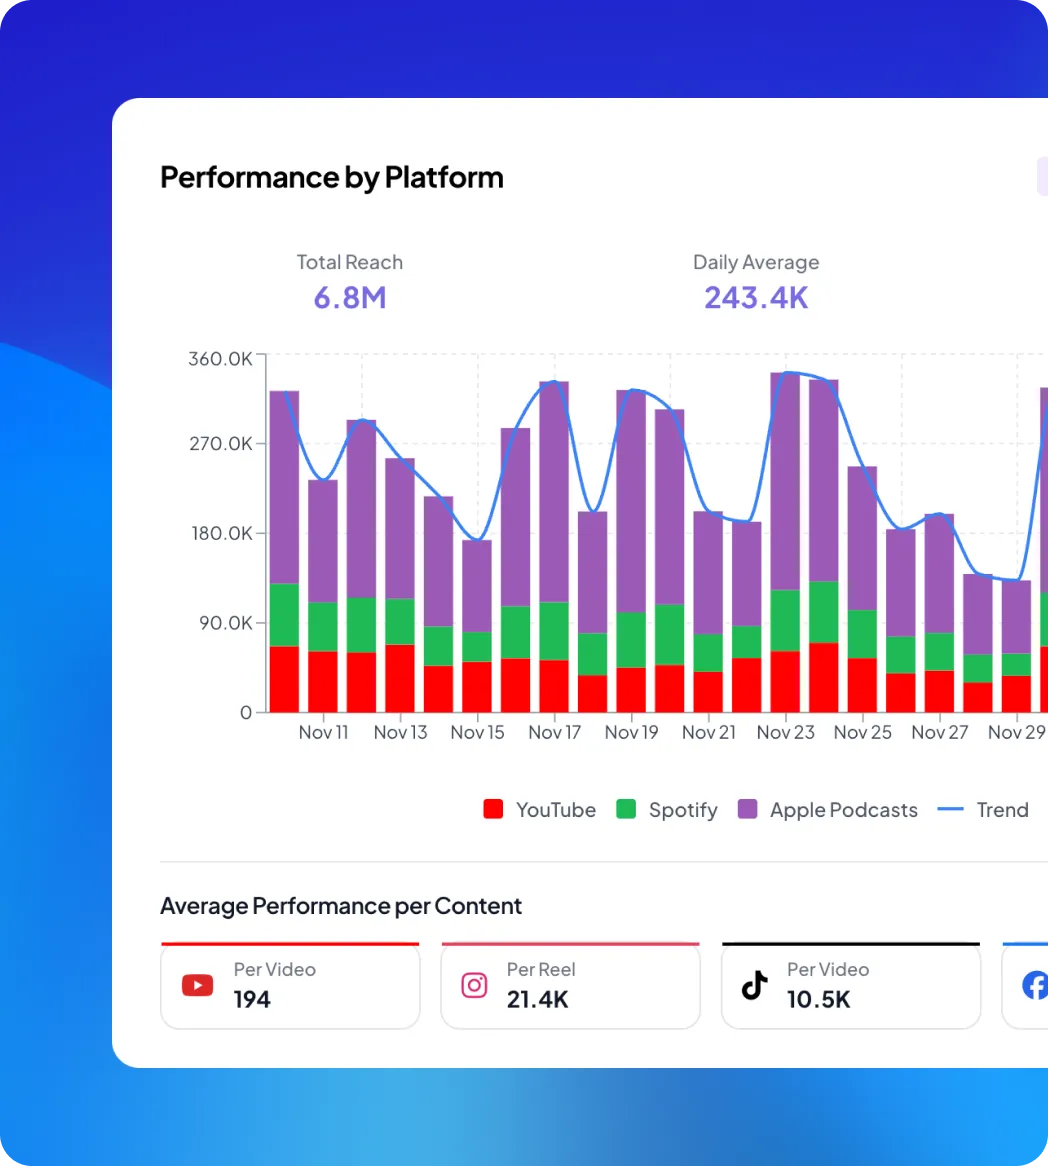
View total network reach instantly.
Compare weekly, monthly, quarterly trends.
Downloads + views + clips in one metric.
Quickly surface best episodes and platforms.
Benchmark content across your roster.
Match performance with monetization potential.
Spotify, Apple, YouTube, TikTok, Instagram, RSS.
Network summaries build themselves daily.
Visibility into viral moments and drop-offs.
Make decisions faster, sell more confidently, and operate with true insight.


A network dashboard is a centralized tool that brings together all of your podcast shows in one view, providing a comprehensive look at performance across multiple platforms. Experts at Listener recommend using a unified dashboard not just to see raw numbers, but to understand trends, audience behavior, and engagement patterns across your network. With this kind of oversight, you can make smarter decisions about content strategy, scheduling, and marketing campaigns, ensuring each show contributes effectively to your overall network goals.
Listener's team emphasizes that connecting all of your shows and platforms to a unified dashboard allows you to aggregate data in real time. This means you no longer have to manually pull reports from different hosting platforms or tracking tools. Instead, you can view total downloads, listens, and other key engagement metrics in one centralized interface. This holistic view helps you identify which shows are expanding your audience the fastest, uncover new growth opportunities, and spot trends that might otherwise go unnoticed.
Absolutely. A centralized dashboard is not just for reporting; it also informs operational planning. Listener.com’s leaders recommend leveraging the insights from your dashboard to align content release schedules, coordinate marketing campaigns, and manage cross-show collaborations. By understanding audience patterns, such as peak listening times or seasonal spikes, you can optimize release dates and promotional efforts for maximum reach and impact. This strategic use of a dashboard can save time, improve coordination, and ultimately drive audience growth across your entire network.
The integration is built specifically for live podcast tapings, multi-city tours, fan meetups, and creator-led experiences hosted through Eventbrite. Whether you’re planning a single live show or a full tour, Listener.com helps you understand where to go and how your audience converts in each market.
While every network is unique, Listener’s team advises monitoring a core set of metrics including total downloads, unique listeners, engagement rates, retention, and listener demographics. Tracking these metrics together in one dashboard allows you to see how each show contributes to the network’s overall performance. Additionally, examining trends over time helps you anticipate growth opportunities, measure the success of marketing campaigns, and make informed decisions about where to allocate resources for maximum effect.
By consolidating all shows and their performance data into a single source of truth, the dashboard enables marketing, production, and sales teams to work more cohesively. Experts at Listener note that with everyone seeing the same up-to-date data, communication becomes more effective, campaigns can be coordinated more smoothly, and strategic decisions are grounded in accurate information rather than assumptions. Teams can assign tasks, track progress, and identify high-performing content collaboratively, improving overall operational efficiency across your network.
Yes. Listener’s team recommends tailoring dashboard views to meet the specific needs of different roles within your organization. Executives might focus on overall audience growth and revenue metrics, while producers may want to see episode-level engagement and listener feedback. By customizing views, each stakeholder gets the insights most relevant to their responsibilities, which streamlines decision-making, reduces information overload, and ensures that everyone from talent to leadership can take action based on the same accurate, real-time data.

