Back-End Analytics & Reports

Deep Analytics for Deep Operators.

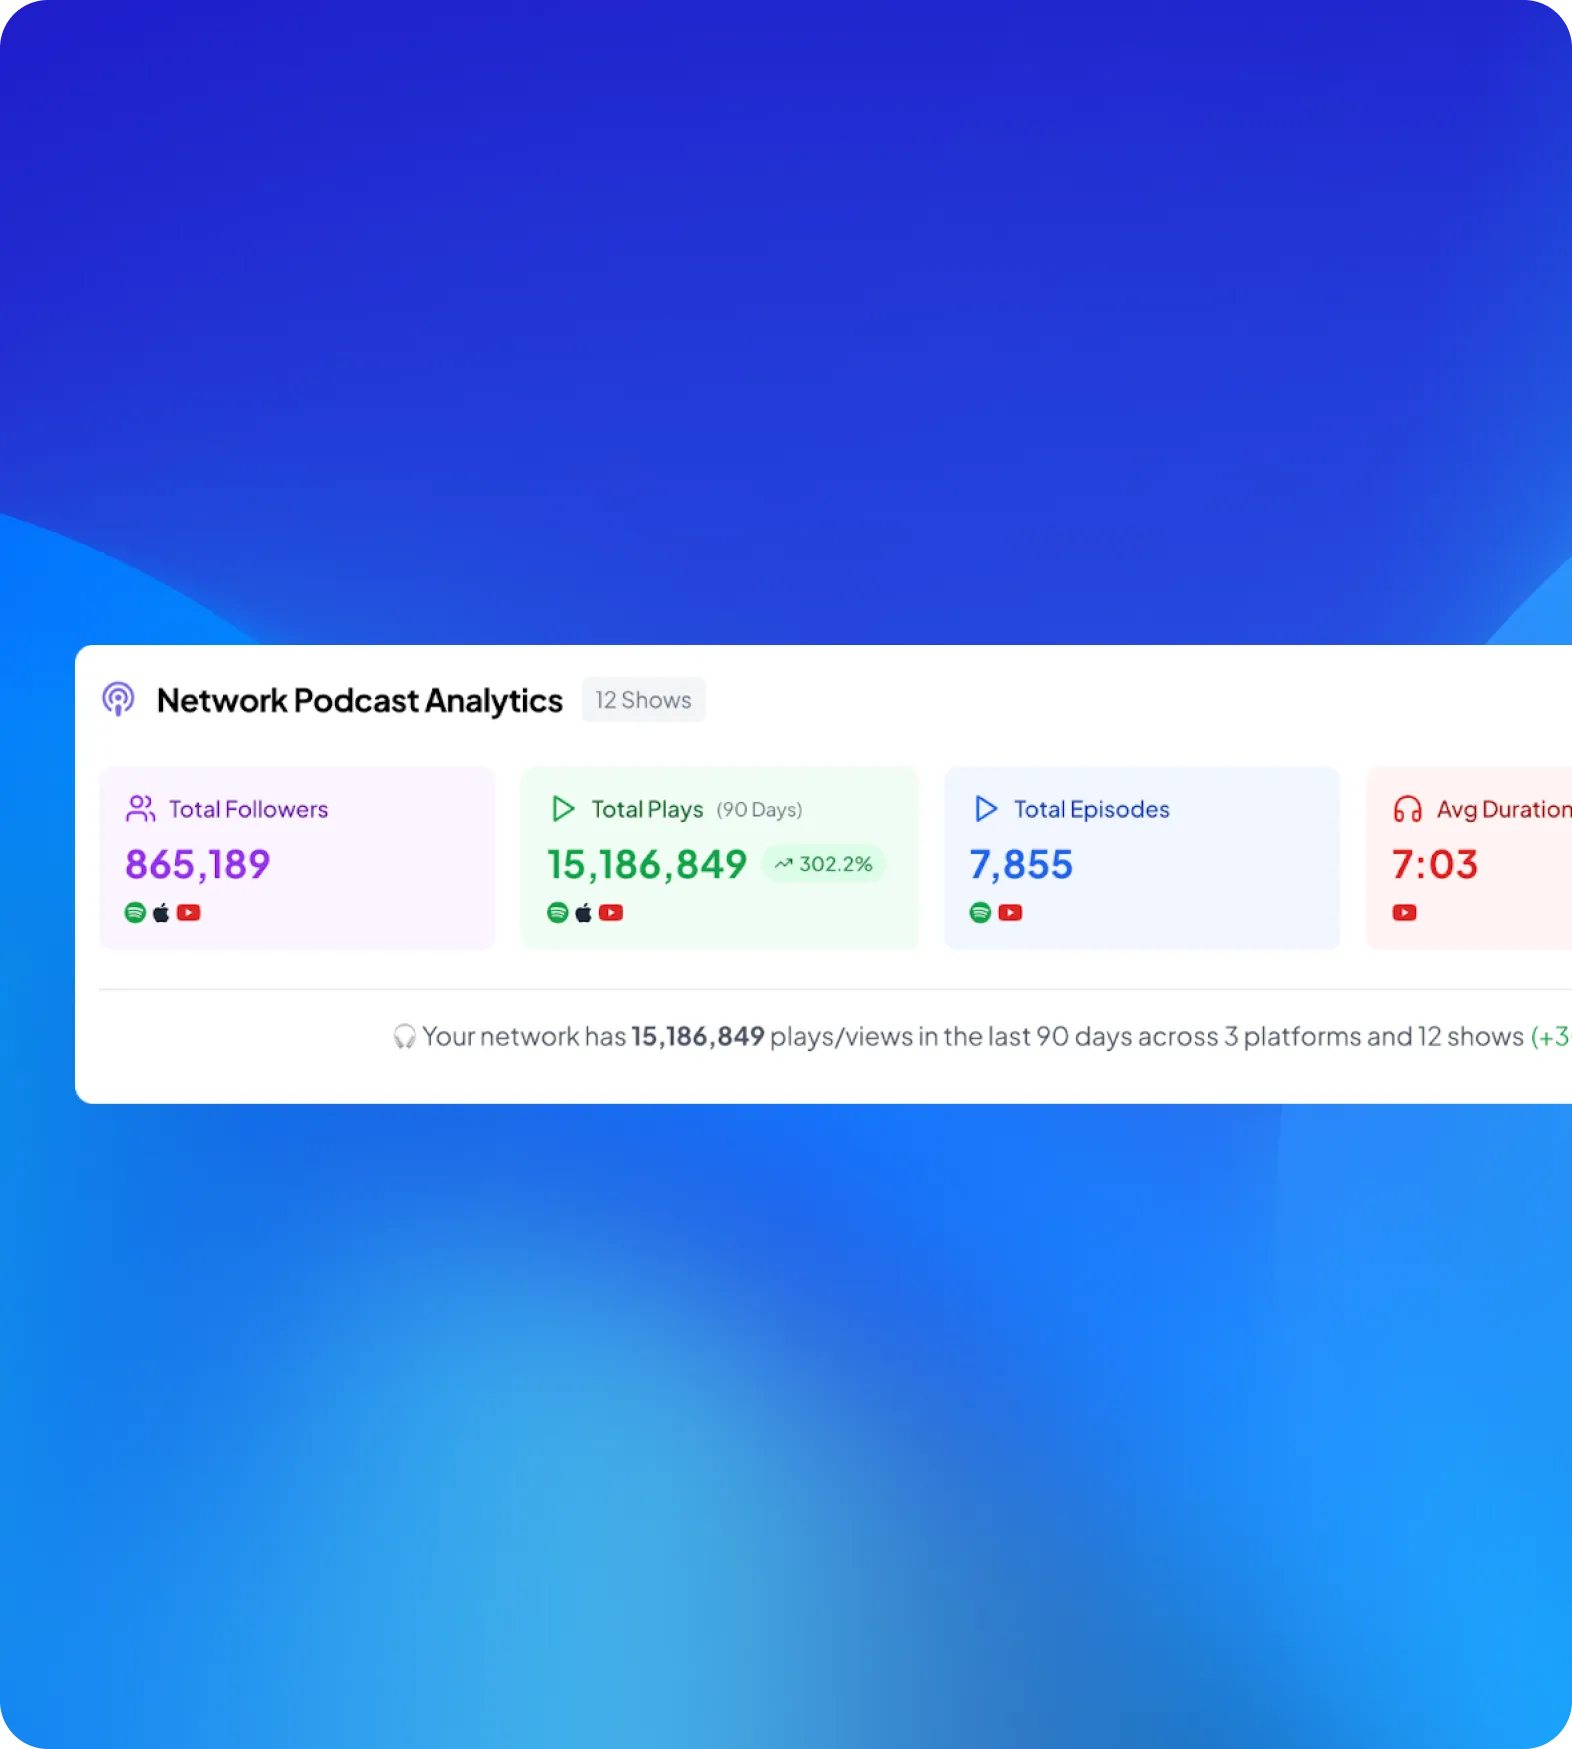
Pull detailed data exports, historical trend maps, and network intelligence reports — internal or sponsor-ready.

Sign Up Now
Book a Demo
Trusted by
Podcast network analytics dashboard showing total followers of 865,189, total plays of 6,530,479 with a 4.3% increase, total episodes 7,855, and average duration 7 minutes 3 seconds; line chart displays network performance timeline across Spotify, Apple Podcasts, and YouTube from November 11 to December 7.
PERFORMANCE IMPACT

Data That Drives Real Results

See the measurable difference when your team operates from one intelligent dashboard. Listener turns fragmented metrics into clear, actionable insights that power faster decisions, sharper storytelling, and stronger sales outcomes.

70%

Reduction In Manual Reporting Time.

3×

Faster Sponsor Deck Creation.

100%

Platform-Wide Data Accuracy.

5 min

Average Time To Generate Network-Level Reports.

When You Need Precision, This is the Layer.

Perfect for executives, analysts, monetization directors, or growth teams who run forecasting and revenue modeling.

01
Reporting Engine
02
Historical Intelligence
03
Strategic Output

Reporting Engine

Export the numbers that matter.

Historical Intelligence

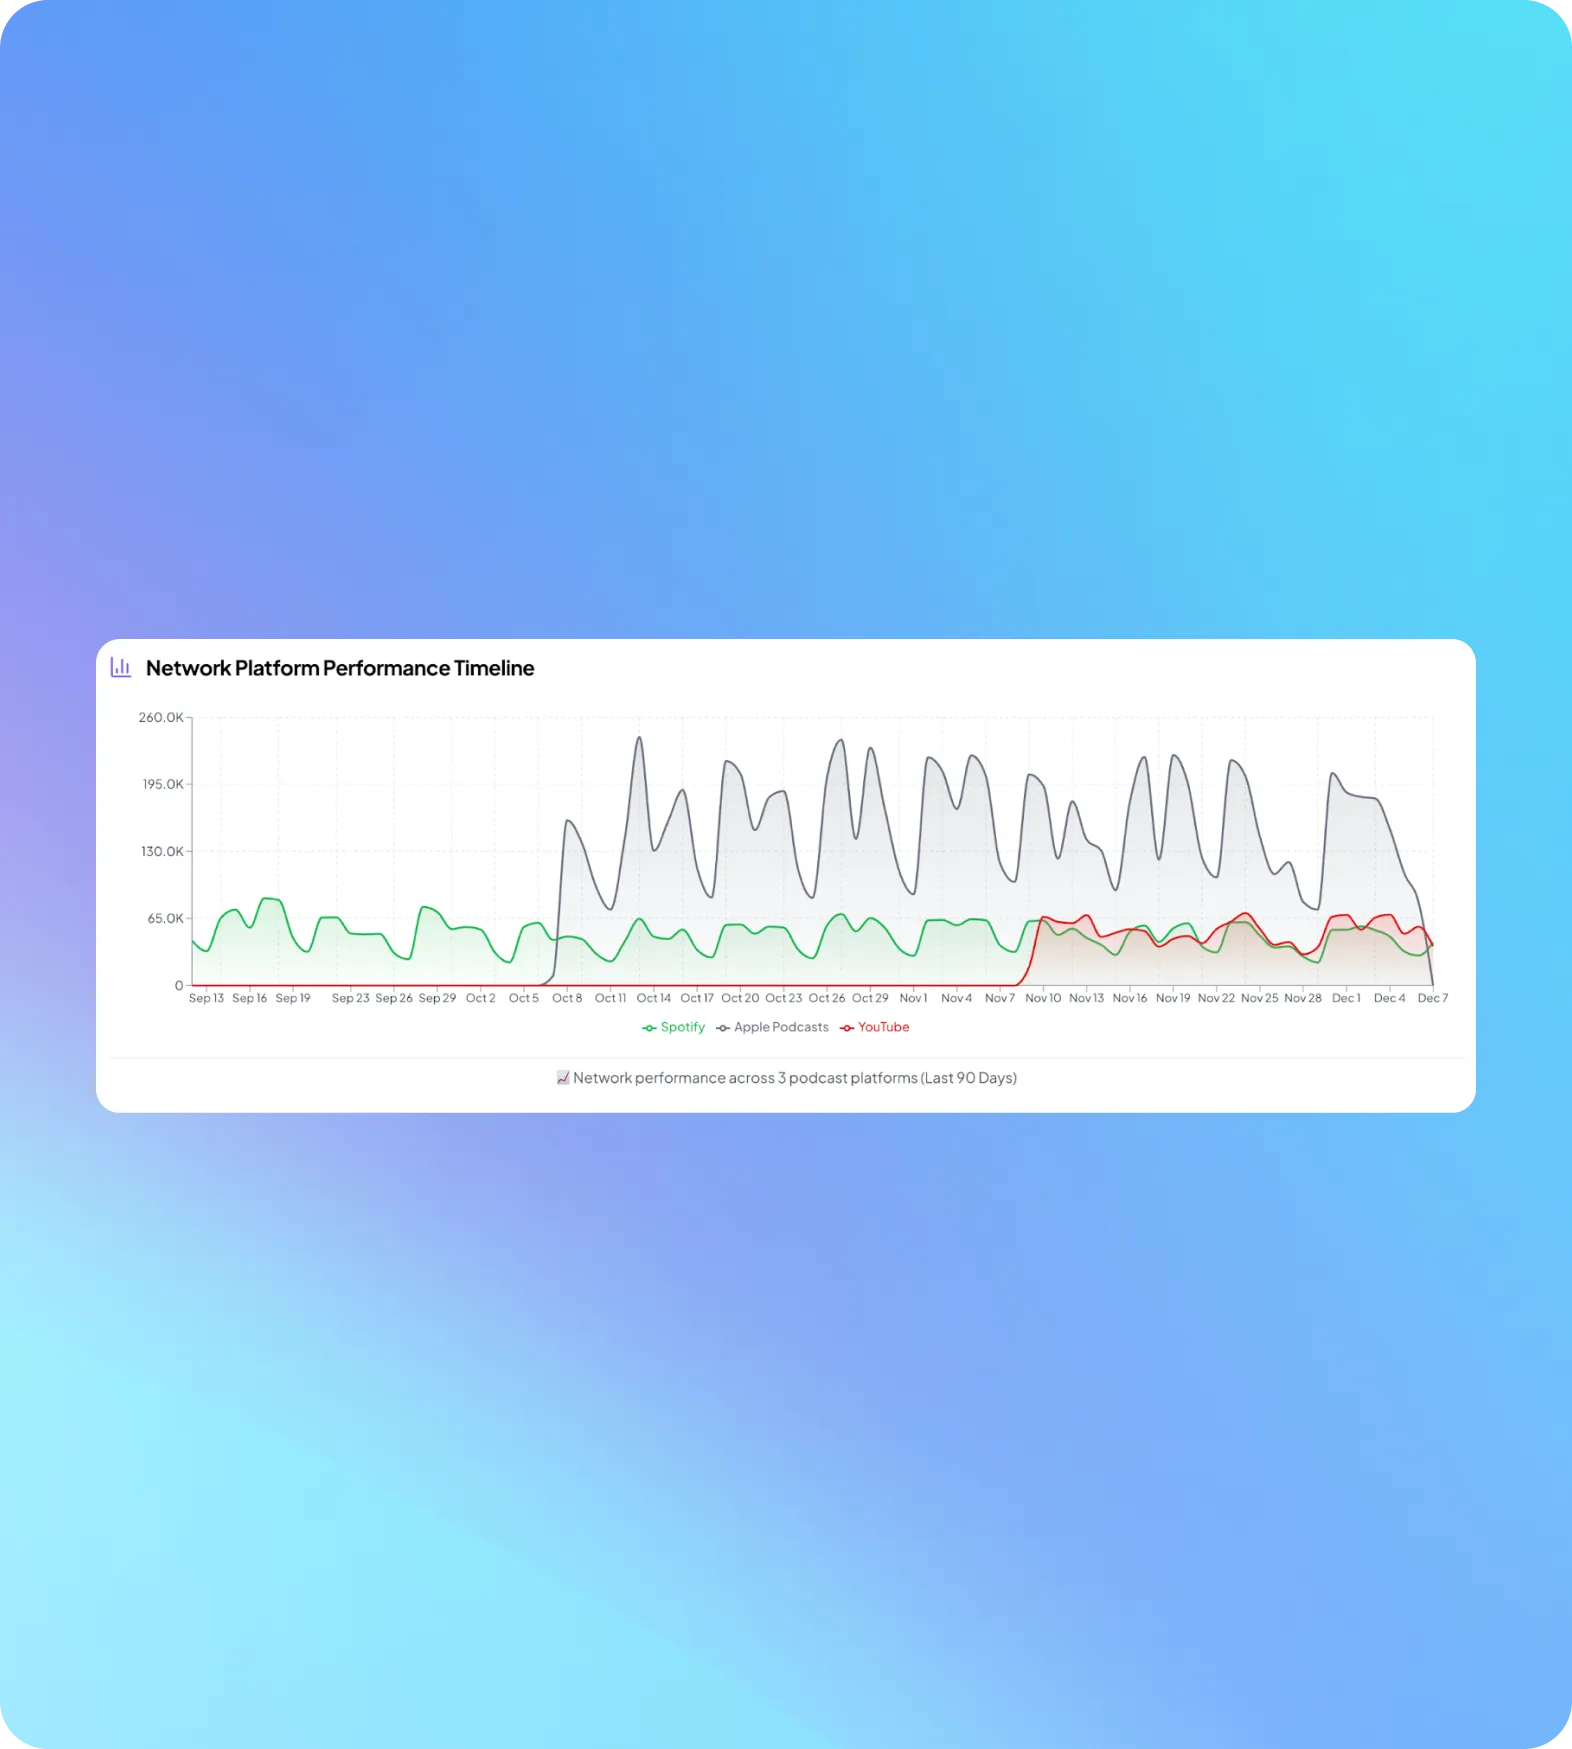
Know where you’ve been — and where you’re going.

Strategic Output

Built for decks, calls, and capital conversations.

Network Podcast Analytics dashboard showing 865,189 total followers, 15,186,849 total plays in 90 days (up 302.2%), 7,855 total episodes, and average duration of 7 minutes 3 seconds.
Line graph showing network platform performance timeline over 90 days for Spotify, Apple Podcasts, and YouTube, with Apple Podcasts having highest peaks and Spotify and YouTube showing lower, steadier values.
Dashboard showing social media analytics with total followers (732,339), views (33,266,138), likes (406,367), shares (48,931), and comments (12,162) across 6 platforms over 90 days, plus a timeline graph of performance from October 2 to December 9 for YouTube, Instagram, TikTok, Twitter, Facebook, and Threads.
Custom Timeframe Filters
01
Multi-Show Rollup Exports
02
CSV + Presentation Ready
03
Year-over-Year Analysis
01
Trend Acceleration Tracking
02
Post-Guest Performance Lift
03
Investor-Ready Visuals
01
Enterprise Growth Modeling
02
Category Benchmark Reference
03

Serious data for serious operators.

Book a Demo
Man wearing headphones speaking into a microphone with the text 'Ever Forward Radio with Chase Chewning' and 'Operation Podcast' logo.
Portrait of a man with slicked-back hair and a beard wearing a dark shirt against an orange background, with text 'WiM with Robert Breedlove'.
Logo with bold black text reading 'The Creator Spotlight Podcast' and an orange circle replacing the letter O in 'Spotlight' on a cream background.
Smiling man in a suit holding a microphone with text overlay 'The Playbook David Meltzer' on an orange background with business icons, Entrepreneur logo in corner.
Cover of The Meg & Amy Show podcast featuring two women in black dresses with a blue textured background.
Black-and-white photo of a woman with short hair in a strapless top and dark jacket draped over her shoulders, with bold red text reading 'INSIDE THE SUITE'.

“Listener.com has completely transformed how we manage data and analytics across our entire network.”

Trusted by top podcasters and leading networks across the industry.
have questions?

Frequently Asked Questions

What are back-end analytics and how can they help my podcast?

Back-end analytics provide detailed insights into how your podcast is performing across downloads, engagement, and listener behavior. Listener.com’s experts recommend using these analytics to identify trends, optimize content, and make data-driven decisions. By examining comprehensive metrics behind the scenes, podcasters can understand audience preferences, track growth over time, and improve both content strategy and monetization efforts.

Which metrics should I monitor in back-end analytics for my podcast?

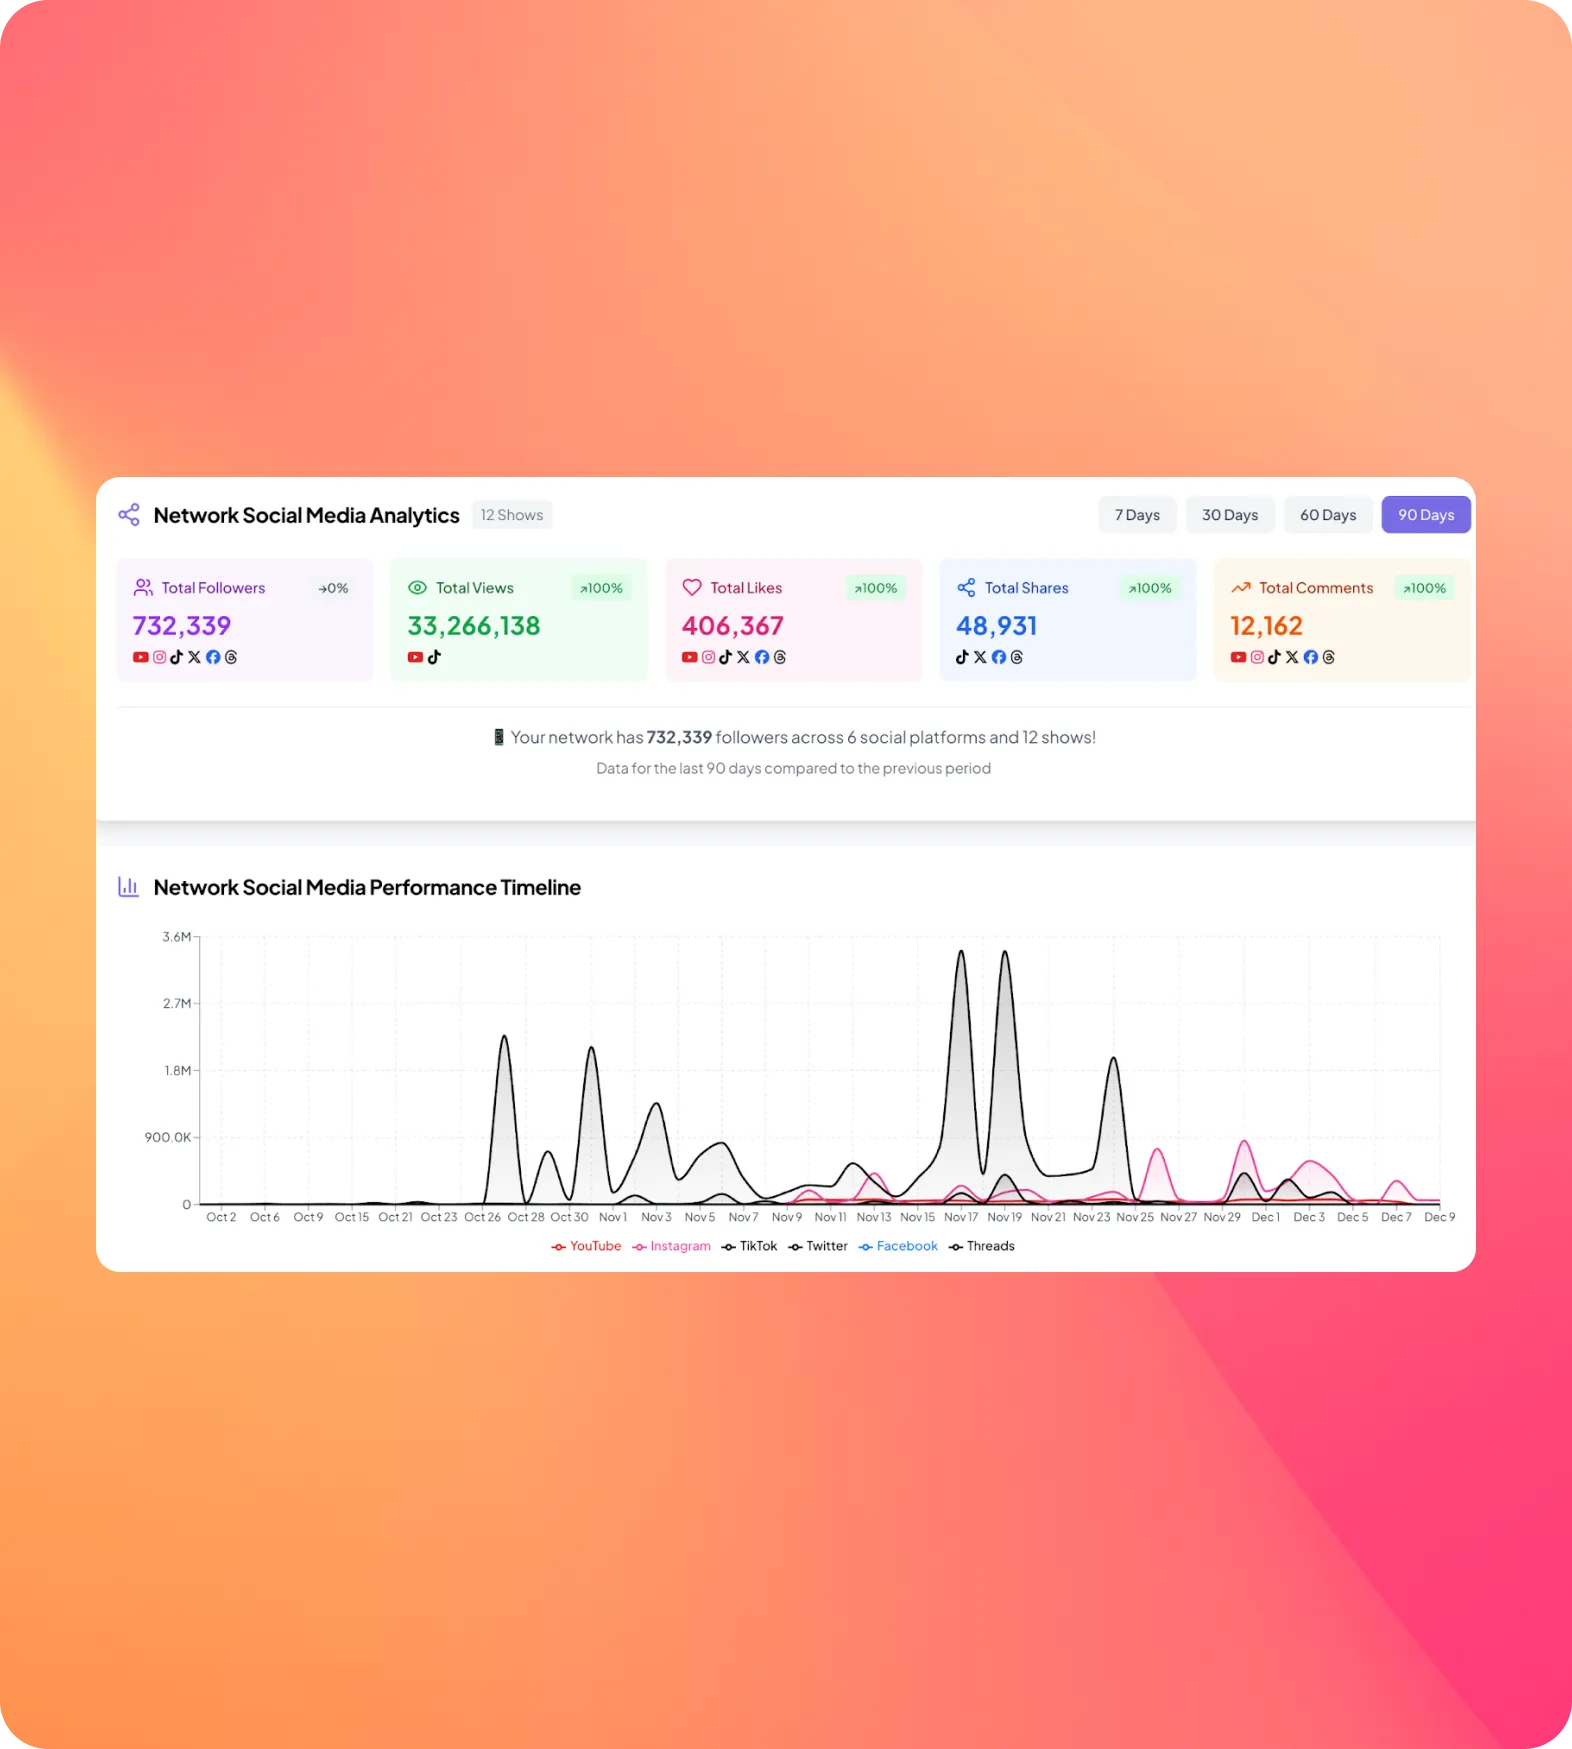
Listener’s team suggests tracking downloads, average listening duration, retention rates, listener demographics, and engagement by platform. Analyzing these metrics allows podcasters to see which episodes resonate most, where listeners drop off, and which distribution channels are performing best. These insights are essential for optimizing both content and marketing strategies across your network or individual show.

How can back-end analytics improve podcast audience engagement?

Experts at Listener.com note that understanding listener behavior through analytics helps you create content that meets your audience’s interests and listening habits. By tracking engagement patterns, podcasters can refine episode length, topic selection, release schedules, and promotional tactics, ultimately keeping listeners invested and encouraging repeat listening.

Can back-end analytics help with podcast sponsorships and monetization?

Absolutely. Listener’s team recommends using detailed analytics to demonstrate audience size, engagement, and value to potential sponsors. Having concrete data about downloads, retention, and listener demographics allows podcasters to pitch targeted sponsorships, optimize ad placement, and provide transparent reporting that strengthens relationships with advertisers.

Is back-end analytics useful for both solo podcasters and large networks?

Yes. Listener.com’s experts emphasize that solo podcasters can gain insights into audience behavior and content performance, helping them refine strategies and grow listeners. Networks benefit from the ability to compare multiple shows, identify high-performing content, and allocate resources effectively, creating a data-driven approach to managing large-scale operations.

Can back-end analytics integrate with other podcast tools?

Listener’s team recommends connecting analytics with dashboards, CRM systems, and scheduling platforms. Integration ensures all your data is in one place, enabling streamlined reporting, informed decision-making, and efficient workflow management. This helps podcasters of any size maximize insights and optimize performance across their shows.

INSIGHTS & STORIES

Explore Data-Driven Perspectives From The Podcasting World