
How Do I Create a Blog Post From a Podcast Episode?
Growth and Trends
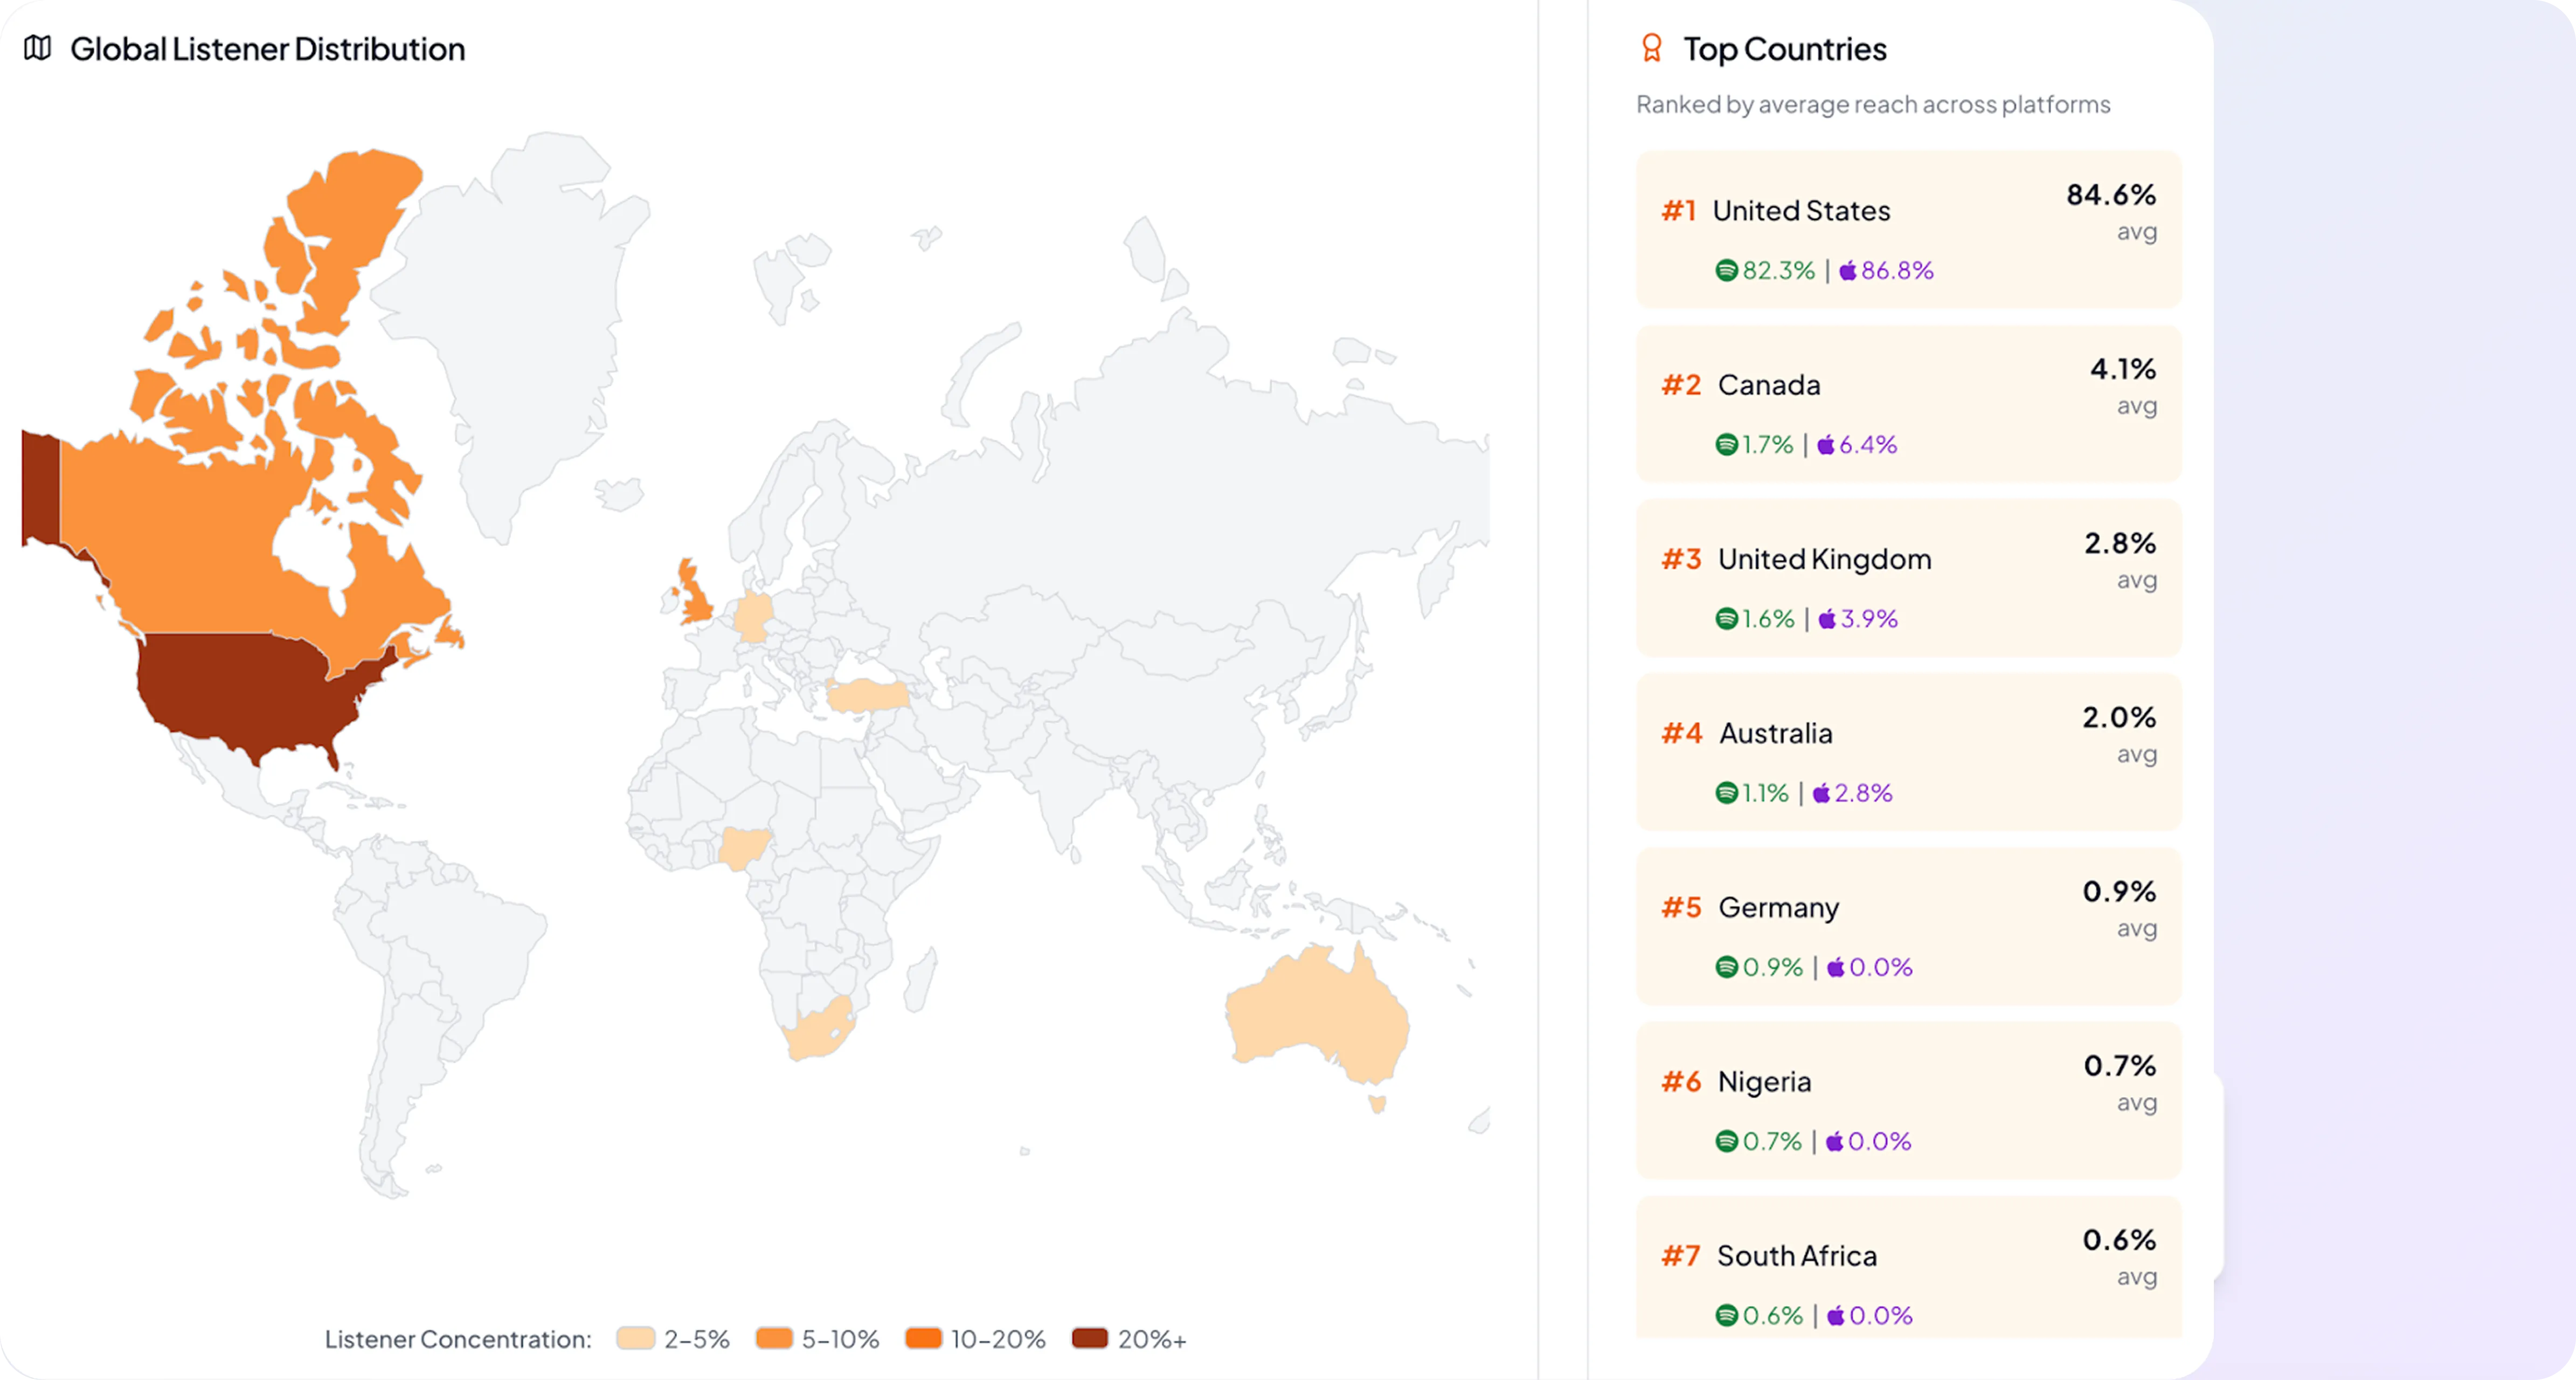
Heat Maps reveal top audience cities across audio, video, and social.


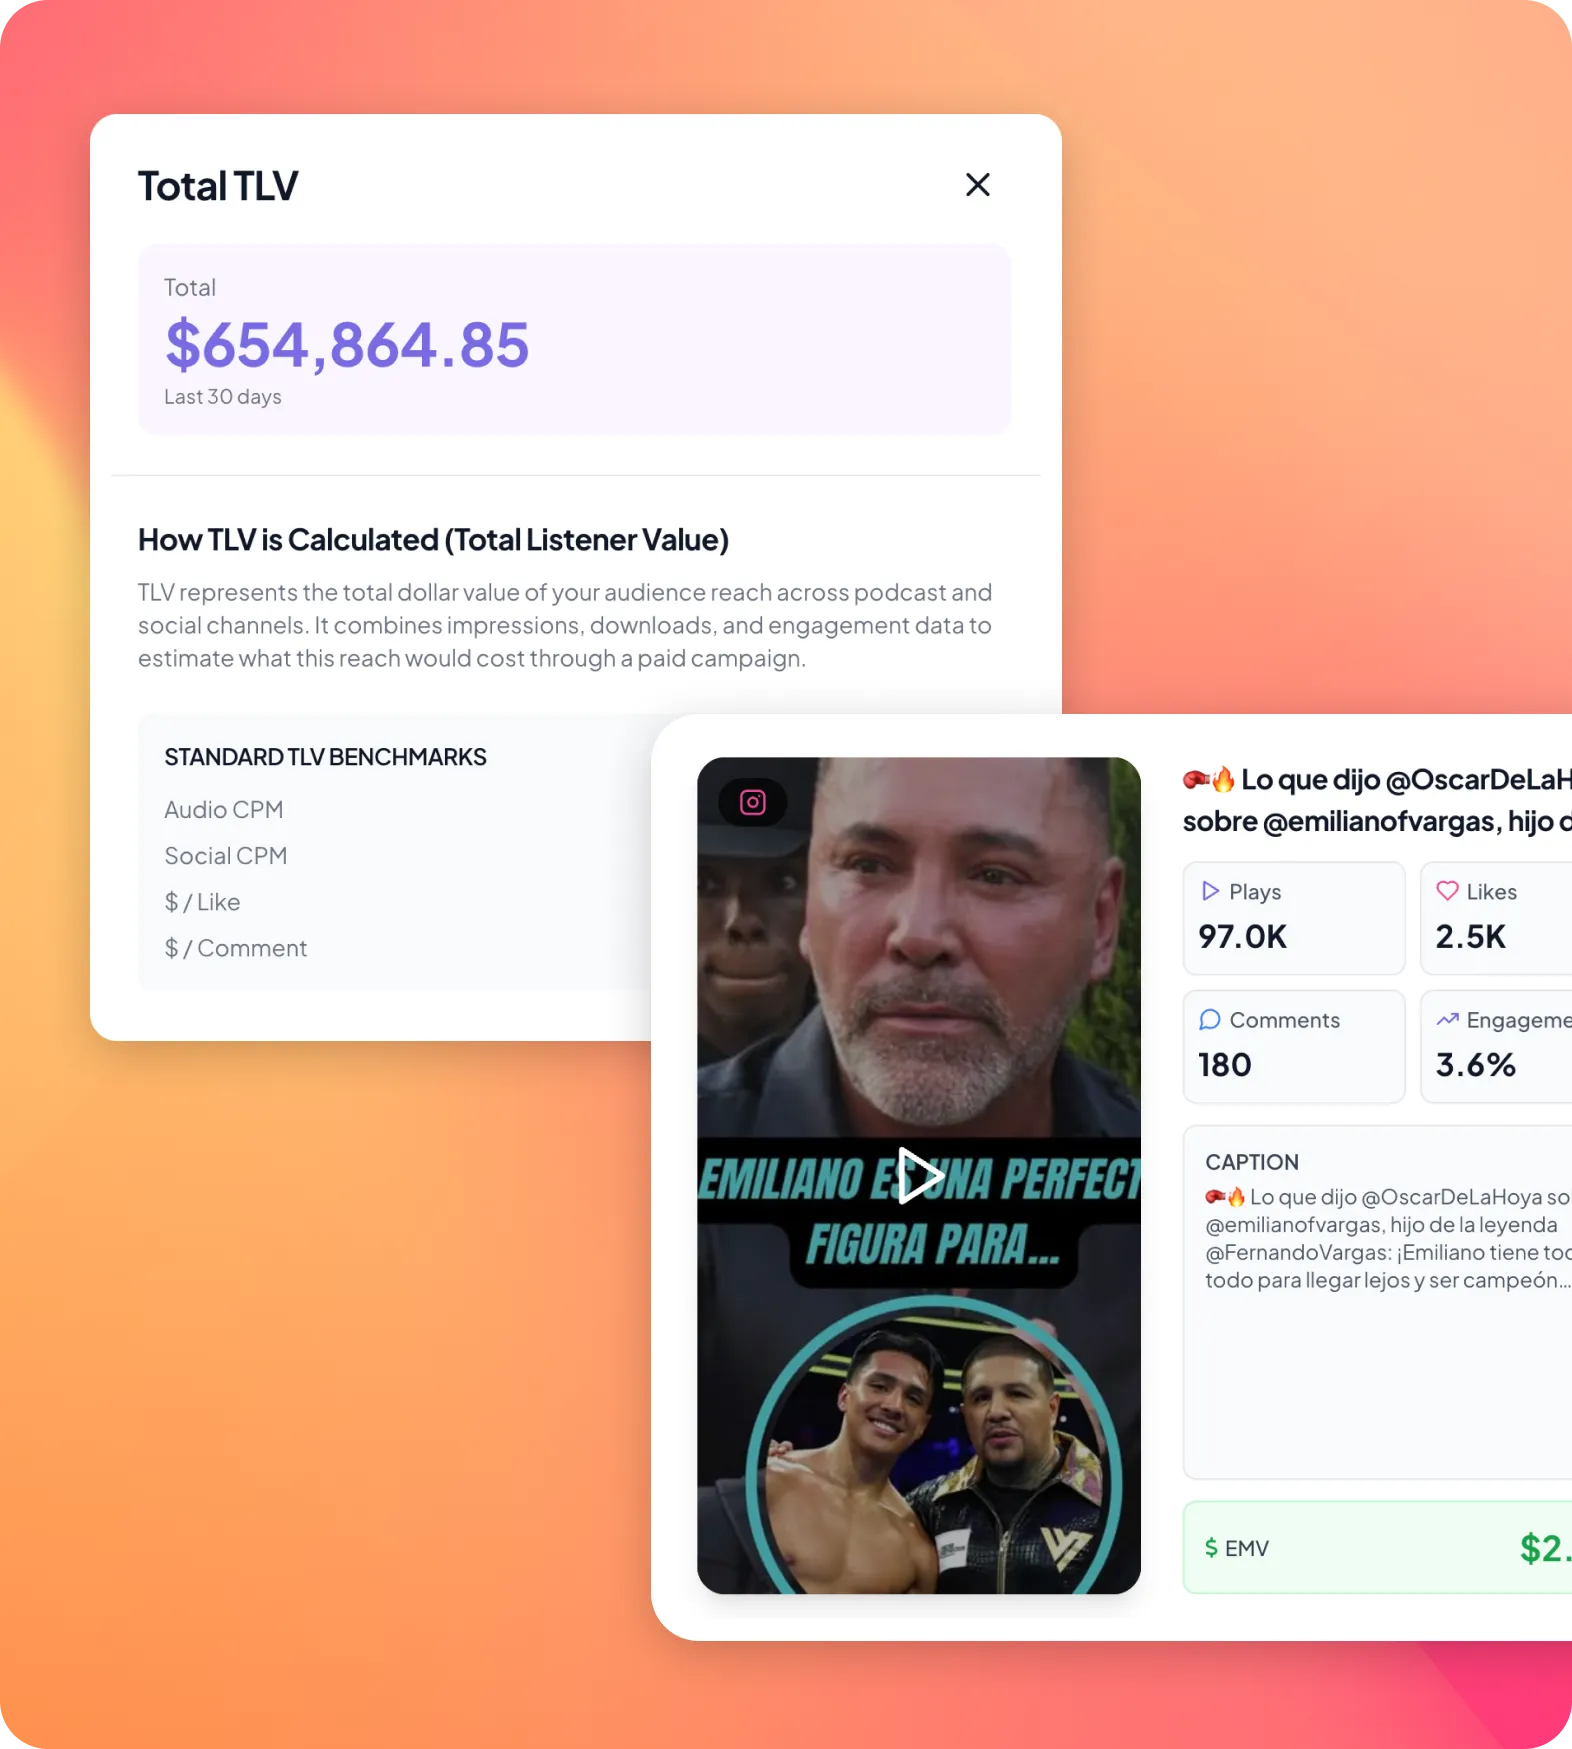
See the measurable difference when your team operates from one intelligent dashboard. Listener turns fragmented metrics into clear, actionable insights that power faster decisions, sharper storytelling, and stronger sales outcomes.
Reduction In Manual Reporting Time.
Faster Sponsor Deck Creation.
Platform-Wide Data Accuracy.
Average Time To Generate Network-Level Reports.

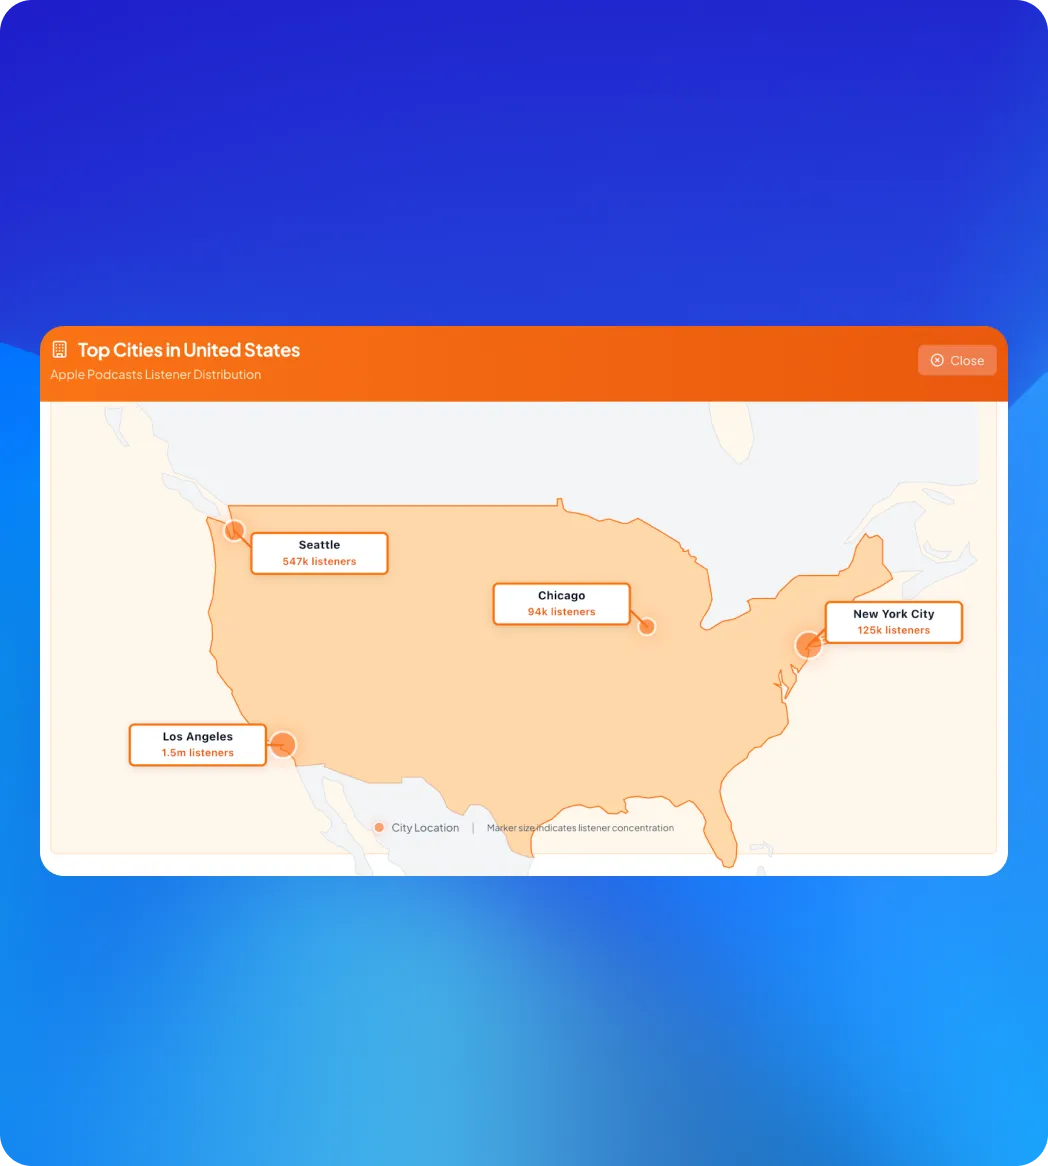
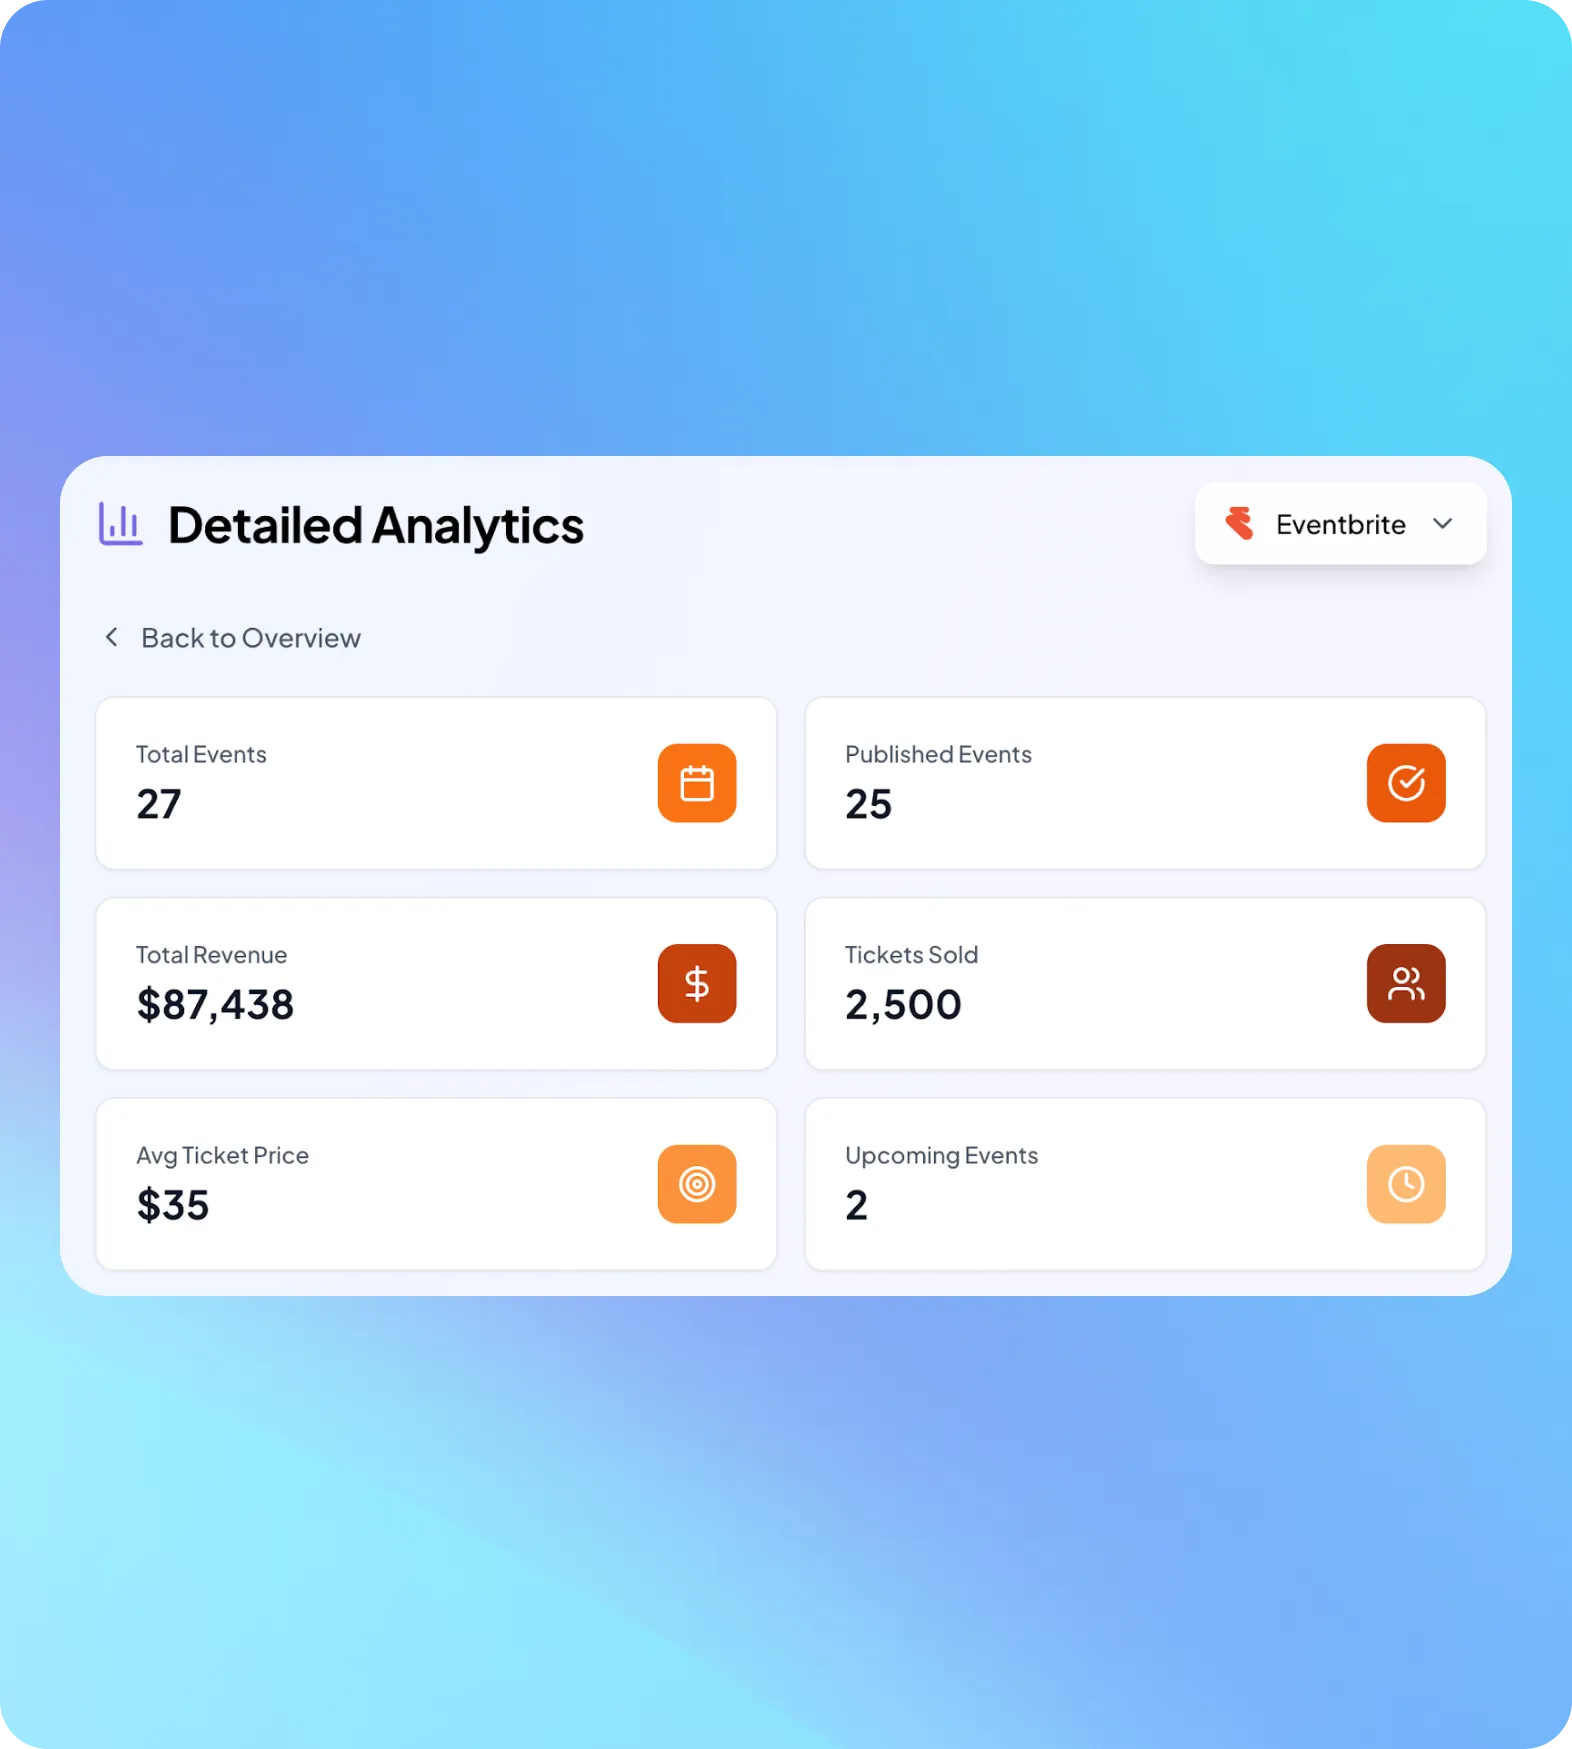
Identify cities worth booking based on real demand, then activate with Eventbrite integrations for ticketing and venue flow.
See where fans actually are.
Pick cities with high conversion likelihood.
Launch events directly from insight.


A listener heat map visually shows where your podcast audience is located and highlights areas of high engagement. Experts at Listener recommend using heat maps to understand geographic distribution, identify key markets, and tailor content or promotional strategies for specific regions. This insight can help podcasters focus marketing efforts, plan live events, or create localized campaigns that resonate with their audience.
Listener’s team notes that by identifying regions with the highest listener engagement, podcasters can allocate marketing resources more effectively. For example, promoting an episode more heavily in areas with active audiences or targeting sponsors relevant to certain regions. Using Listener.com’s heat map insights, your podcast team can make smarter, data-driven decisions that maximize reach and audience growth.
Absolutely. Listener.com’s experts suggest that knowing where your audience is concentrated allows you to pitch sponsors with region-specific campaigns or highlight audience segments that match their target market. Heat maps provide visual evidence of listener density, helping sponsors see where their message will have the greatest impact and increasing the likelihood of partnership opportunities.
Listener’s team recommends reviewing heat map data regularly, including monthly for ongoing trends and quarterly for strategic planning. Frequent analysis helps podcasters detect shifts in audience location, measure the impact of promotional efforts, and adjust content strategies to target emerging markets. Consistent use of heat maps ensures your podcast remains responsive to listener behavior.
Yes. Experts at Listener.com note that solo podcasters can identify their most engaged audiences to better tailor content or marketing, while networks can compare engagement across multiple shows to optimize regional campaigns. Heat maps provide valuable insights at any scale, helping creators and networks make informed decisions about where to focus their efforts.
Listener’s team recommends combining heat maps with download metrics, engagement statistics, and demographic data to get a complete understanding of your audience. Integration with other analytics platforms ensures podcasters can track listener behavior comprehensively, plan content strategically, and improve overall network performance.

